InsightDock Charts for C++
Native C++17 charts for reports and embedded devices. PNG, JPEG, and native vector SVG and PDF from one call. MIT-licensed, no GUI toolkit, no Python.
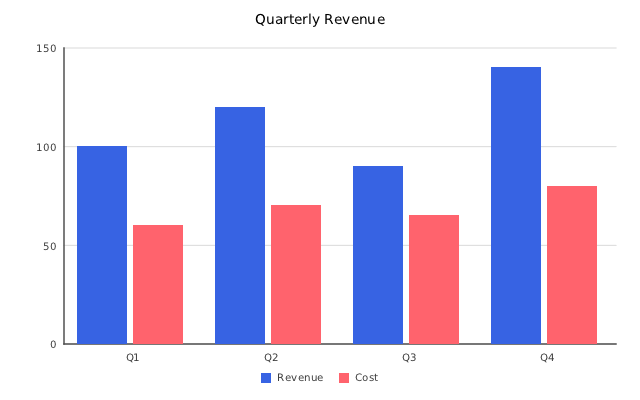
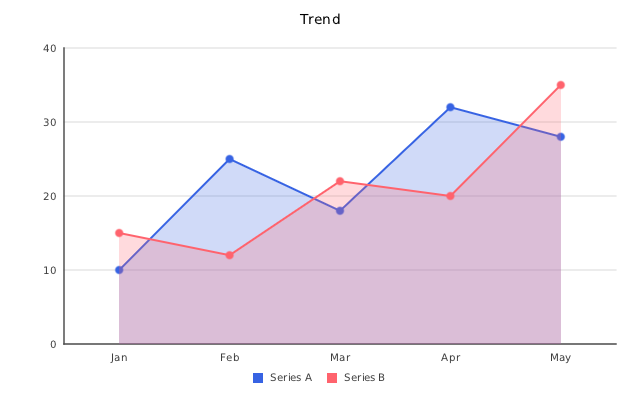
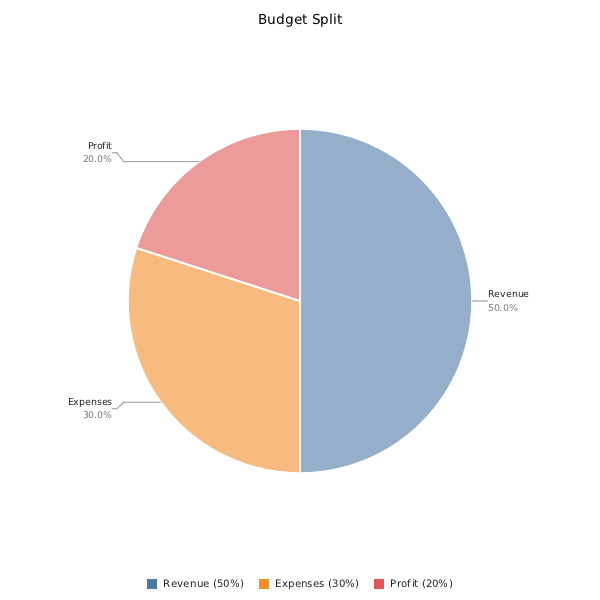
InsightDock Charts renders from a daemon, CLI tool, container or router: no window, no Qt, no Python. SVG and PDF output contains real paths and selectable text for pie, bar, line, area and combo charts. The core needs only the C++17 standard library, and a Make build targets OpenWrt.
It is static output only. For interactive zoom and pan, see the comparison for better-suited libraries.
Quick start
#include "insightdock/charts.h"

using namespace insightdock::charts;

PieChart pie;
pie.add_slice("Online", 72);
pie.add_slice("Offline", 28);
ChartExporter::save(pie, "status.png");
#include "insightdock/charts.h"
#include "insightdock/pdf/podofo.h"

// PDF output needs INSIGHTDOCK_WITH_PODOFO
ExportOptions opts;
opts.pdf_backend = PdfBackend::Vector;
ChartExporter::save(pie, "status.pdf", opts);
See Examples for the full set of sample programs, or jump straight to the API Reference.
Features
- Charts: pie/doughnut, bar (grouped, stacked, 100%-stacked, horizontal), line (area fill, step, spline), area (stacked, 100%), combo with a second y-axis, scatter/bubble, histogram
- Axes: linear, logarithmic, and a date/time x-axis positioned by real timestamp
- Styling: three palettes (Chart.js, Tableau-10, colorblind-safe), per-series dash, marker, width and opacity, reference lines, gap handling for missing values, multi-line titles
- Text: UTF-8; embedded ASCII font, optional Latin-1/Latin-Ext font, or any TTF via
ChartOptions::font - Output: PNG, JPEG, SVG, PDF and a raw RGBA
ImageBuffer; multi-page PDF report builder (PoDoFo) - Robust: non-finite and hostile input is handled without hangs; CI runs ASan/UBSan, and unit tests feed NaN, Inf and oversized input to every chart type
- Thread-safe export: concurrent
render()/save()on a const chart is supported
Where to go next
- Getting started — build with Make or CMake, with or without PDF support
- Concepts — class hierarchy, render pipeline, and how to extend or add a chart type
- Guides — error handling, theming, tick formatting, PDF reports, troubleshooting
- Chart types — every option for pie, bar, line, area, combo, histogram and scatter/bubble
- Examples — every sample program, source and rendered output side by side
- API Reference — generated from the headers by MrDocs
- Comparison — how this stacks up against commercial and open-source alternatives
- Changelog — release history